Welcome back to week 2 of our Waves Networking series. Last week we spent a bit of time going over a few extra details regarding setting up your network with the right gear and getting your host OS to play well with the waves soundgrid network (in the form of driver settings). If you missed it, check it out at this link! This week I’m going to be going through three tools that I use to monitor my setup and which help to troubleshoot issues before or during issues that happen within this fragile ecosystem. I’m not going to be talking about troubleshooting this week but stick around until next week. I wanted to spend some time talking about what I’m keeping an eye on so I can spend more time discussing troubleshooting next week and less time defining terms. Let’s dig in!
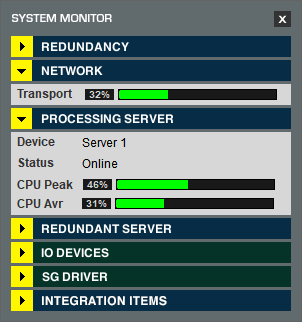
It all starts with the system monitor. In Multirack you can open it as a separate window found in the audio menu. Unfortunately in LV1 there isn’t a a system monitor. There are a few things you can monitor SoundGrid Studio, but you’ll have to rely on the windows task manager for some of this info. From here you can monitor the status of everything in your soundgrid network. There are a few key things to keep an eye on: the first is the transport percentage, the second is the processing server peak and average meters. What you’re looking for here is stability. We don’t want these numbers to be jumping up and down all over the place. They will move and adjust but shouldn’t be jumping too erratically. Side note, I’ve noticed having some reverb plugins in use can cause the cpu peak to jump a bit, as long as you don’t have audio dropouts you should be just fine.
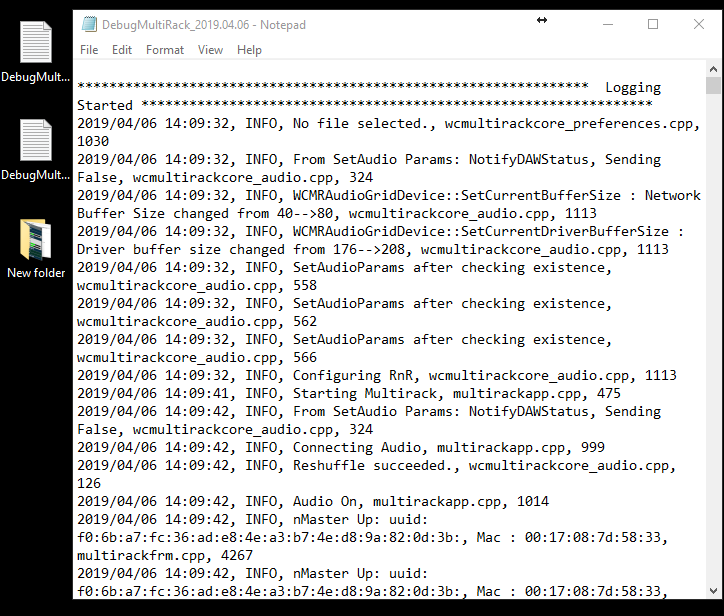
The second tool I use to monitor my setup is the verbose log. In Multirack, go to preferences and on the main tab, there is a checkbox. I believe it’s found in a similar spot in the LV1 software as well as soundgrid studio. I learned about this feature from a waves tech who just wanted me to enable it and send the logs in when the issue I was experiencing happens. Out of curiosity I opened it up (I’d recommend reading it with WordPad as it will organize it better, you cannot open it this way until you turn off the log, use NotePad to monitor while it’s still logging if you want) and started trying to learn what I’m seeing. The software logs any event (i.e. cpu re-organizing on the server, buffer issues, audio dropouts, etc) and attaches a timestamp and mac address with each item. This log won’t always be empty as it logs anything that happens not just bad things. Be sure to utilize the “find” (CTRL + F) function to do a word search. You can search for the term “drop” to see if there have been audio dropouts or search for “buffer” to see if there have been any buffer related incidents and so on. Having a spreadsheet handly of the mac addresses on the network and what they are can be helpful as well as you can then search for those as well. There are a few events that happen that I haven’t found a reason for or a waves tech to explain them to me but most are easy to see and understand. Lots of the log is just the server re-arranging plugins, filesaves, etc. I would encourage you to turn it on and start learning yourself. Even if you don’t have a server, turn the log on so you can start monitoring and learning what’s going on in your soundgrid network.
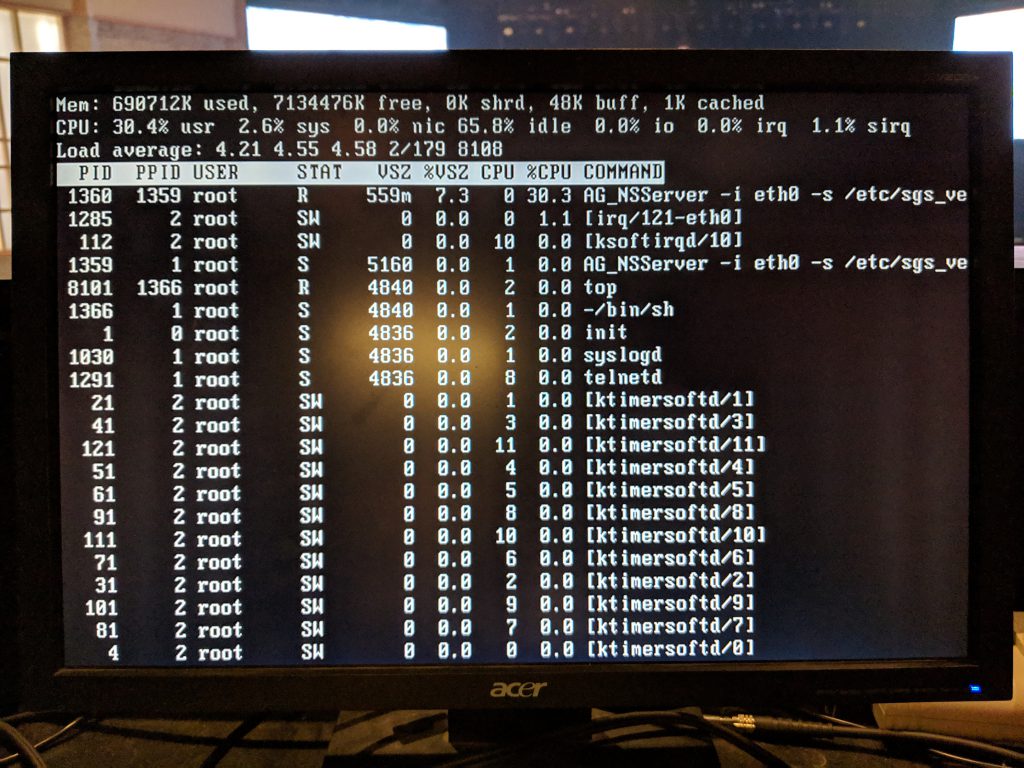
The last tool I use to monitor my network is the “task manager” from the waves server. While there isn’t a GUI persay to the waves server linux software, it is a form of linux. When the boot process completes in the server, you can hit enter and get to the console. From there you can type “top” (which is a task manager baked into most linux OSs) and the console will open up. From here you can see memory usage, cpu usage, and just about anything else you’d want to see. The processes waves is running are the “NG_NSServer” tasks. Usually they are at the top of the list so you shouldn’t have trouble finding them. I’ve noticed that the cpu average meter in the software is a bit off occasionally so if you are really stretching your DSP, using this task manager for cpu monitoring gives you real-time usage info. If you are a knowledgeable linux user you can find some other available commands to expose temperature info and a few other handy items as well. While linux is incredibly difficult to crash, I like having a monitor plugged in and running “top” as it refreshes every second. I can see that it is still running and functioning normally.
That’s it for this week. I hope I’ve inspired a few of you to turn on some of these tools and start monitoring your network. Even spending the littlest amount of time using these tools this week will make next week, the troubleshooting week, a bit easier to follow. You’ll definitely need to utilize all these tools in order to properly identify issues in the future so you may as well get used to using them. If you have any questions about anything I’ve mentioned please feel free to comment below, shoot me a message on facebook, or email me at daniel@studiostagelive.com. If you’d like to receive updates when new content is posted on this site, sign up at this link, and you’ll get an email whenever new content is posted so you can stay up to date. I’d also be curious if any of you have any questions regarding the soundgrid network that I may be able to answer. Leave me a comment here or on facebook and I’ll try to make sure those questions are answered either within a post or a reply to your comment. See you next week!


The command I use the most in the linux shell is “sensors” to keep the temperatures under control!